October Recap - Dashboards and Apps with Shiny
Shiny is an R Package that combines the computational power of R with the interactivity of the web to enable users to create interactive web apps (and dashboards!) in R. For our October meetup, Dr. Mine Çetinkaya-Rundel led a workshop introducing the basics of building dashboards using Shiny, and a demo on transitioning from dashboards to standalone apps. In case you missed the Meetup, all materials (code! slides! more!) can be found on the github repo Mine created.
Building interactive dashboards with Shiny and flexdashboard
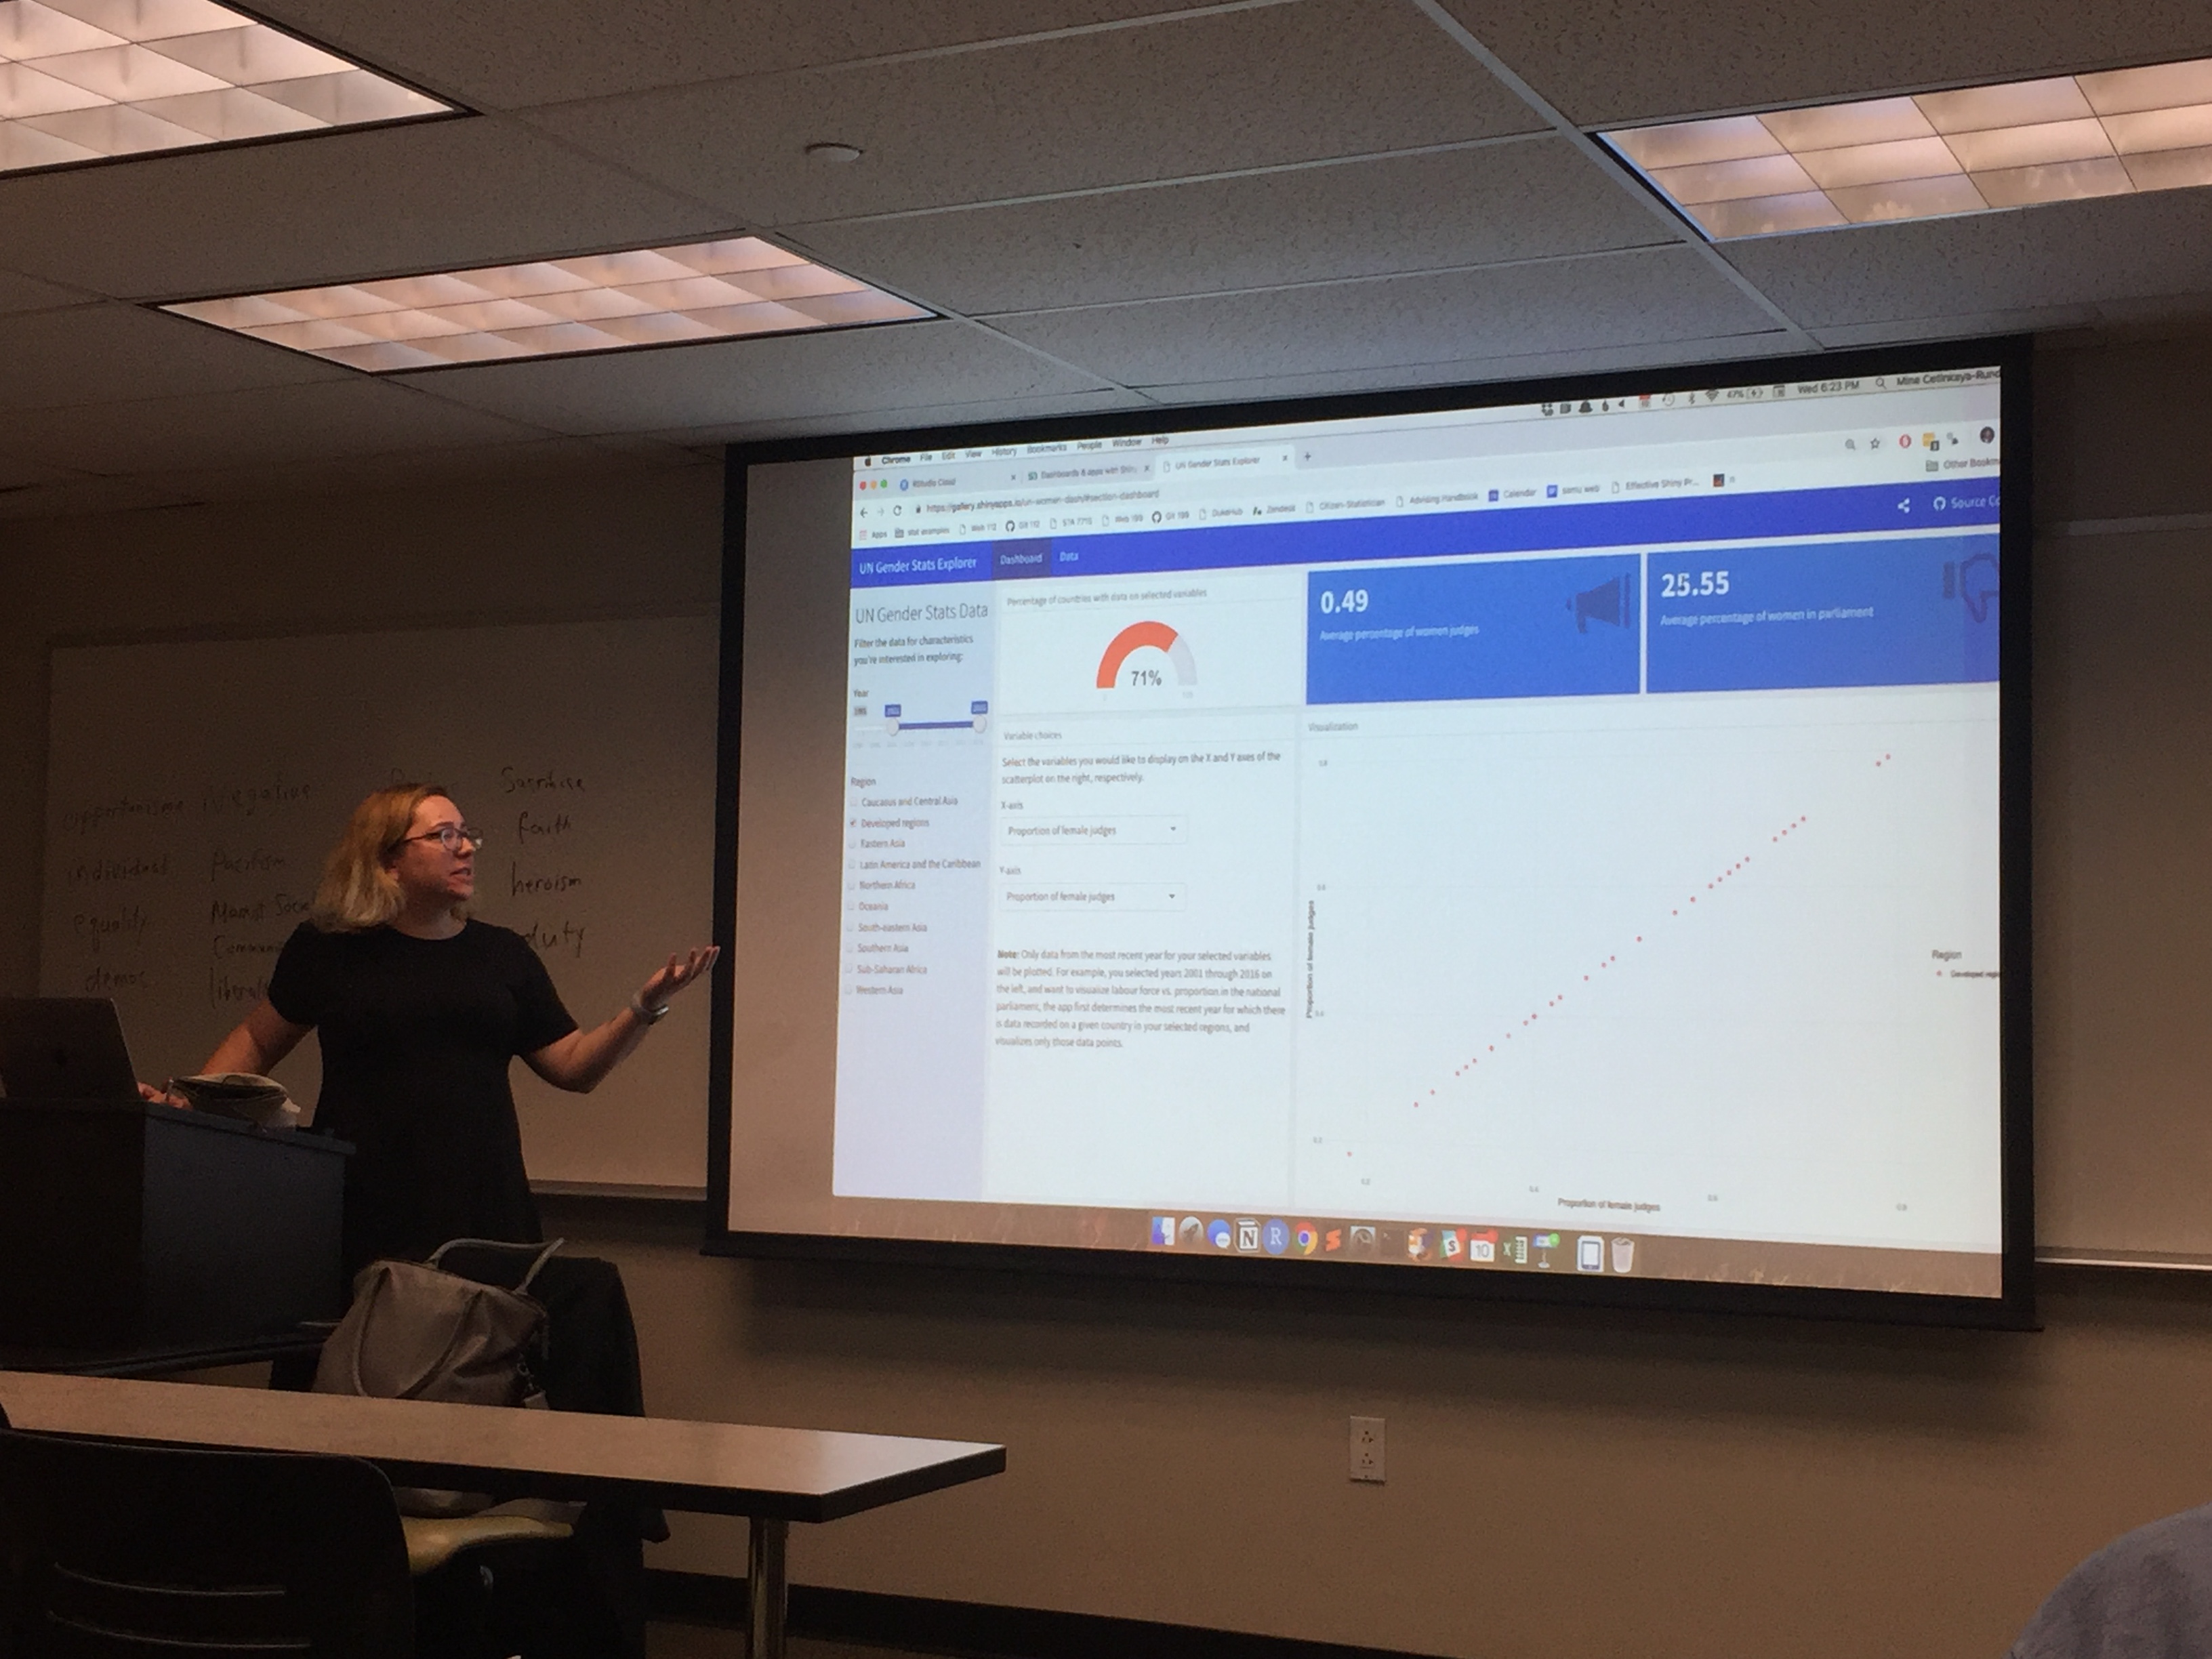
A dashboard is an information management tool that tracks, analyzes and displays metrics and key data points, and can be static (i.e. an html page) or dynamic (i.e. user input updates data displayed in real time). Mine shared a dashboard she created using Shiny and the flexdashboard pacakage to display statistics on gender in United Nations (UN) representatives: https://gallery.shinyapps.io/un-women-dash/
… And gave Meetup attendees hands-on experience editing dashboard content by changing the time period of data shown in the dashboard.
Getting started with Shiny
Next, Mine moved on to how Shiny apps (like the dashboard described above) actually work.
From a high-level view, you first create an app locally (i.e. the computer serving your app is your computer) and then deploy your app on a web server to be accessible to others (i.e. the computer serving your app is a web server).
Mine explained that the ‘anatomy’ of the Shiny app you create is comprised of two core components necessary for deployment on a web server:
User interface - controls the app’s layout and appearance, and is what the user sees on the web
Server function - contains the instructions to the web server needed to build the app
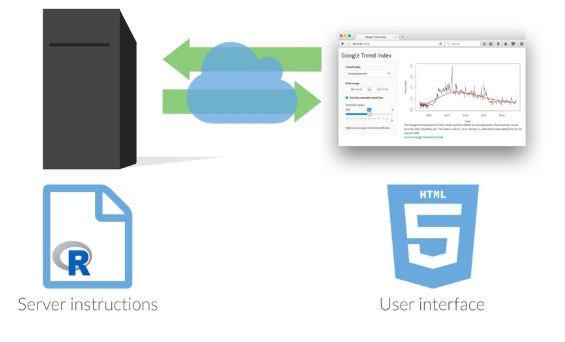
Relationship between Server and UI
After this introduction, meetup attendees practiced editing both app layout and server-generated content using data from the National Health and Nutrition Examination Survey.
Mine also shared a pro-tip on Shiny app creation: users can optimize Shiny app performance by organizing code in a certain order, since Shiny runs some code sections more often than others.
Understanding reactivity
Last, Mine taught us about reactivity - how our apps ‘react’ to information input by the user.
User inputs can be saved as variables, and used in subsequent code to modify app features. For example, a user could input the year of data they want to see plotted, and the app would to only plot data corresponding to the input year. Importantly, the render functions used to create the output of an app (e.g. a table, plot, etc.) update in response to reactive values - this enables the interactivity of Shiny apps.
Temple University Center City
We would like to thank Temple University Center City for hosting our October Meetup!
“Temple Center City’s goal is to serve the adult learning needs of area corporations and their employees and to provide enrichment through community education opportunities for Philadelphia area residents. Since its creation in 1973, TUCC has offered undergraduate and graduate courses, degree programs, and professional development programs to working adults with classes offered primarily during the evenings and on weekends. Visit www.temple.edu/tucc/ for more information!”
This post was authored by Katerina Placek. For more information contact philly@rladies.org